Fig. 4
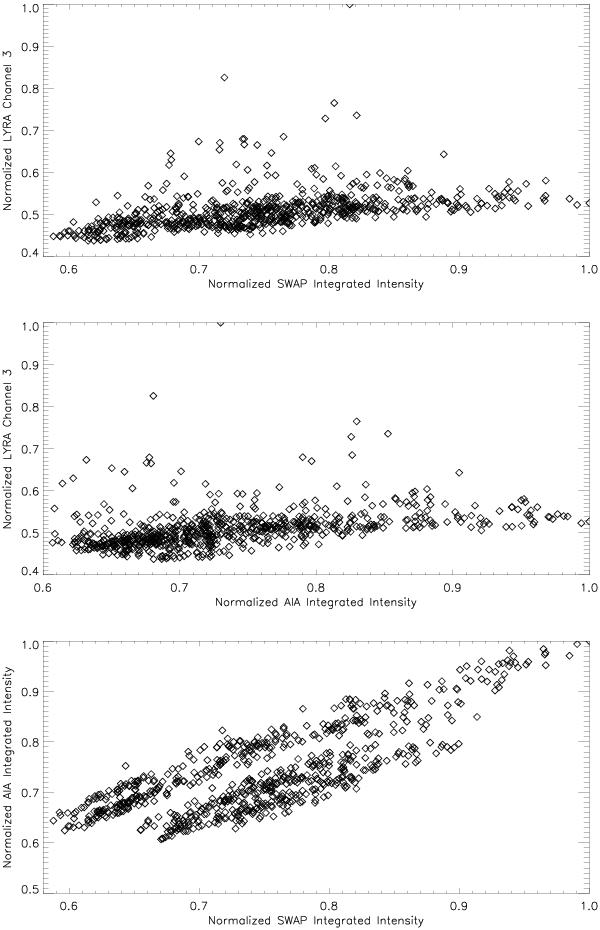
Top panel: scatter plot between LYRA irradiance of channel 3 and integrated intensity of SWAP. Middle panel: scatter plot between LYRA irradiance of channel 3 and integrated intensity of AIA. Bottom panel: scatter plot between full-disk integrated intensity of SWAP and AIA. Here the upper band/family of data points belong to 2012 and whereas the lower family of data points correspond to 2011.
Current usage metrics show cumulative count of Article Views (full-text article views including HTML views, PDF and ePub downloads, according to the available data) and Abstracts Views on Vision4Press platform.
Data correspond to usage on the plateform after 2015. The current usage metrics is available 48-96 hours after online publication and is updated daily on week days.
Initial download of the metrics may take a while.