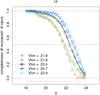
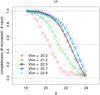
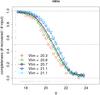
Fig. 2
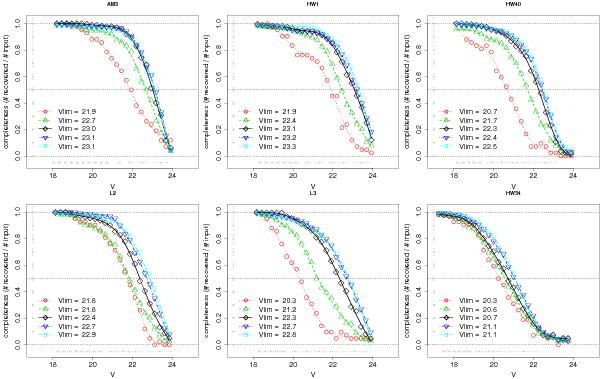
Completeness curves for different distances from the cluster centre, based on V-band photometry. These curves correspond to a ten-order smoothed spline fitted to the data. Different lines are the completeness curves for different annuli, with the respective data points: 0 ≤ r < 10″ (red dotted/circle); 10 ≤ r < 20″ (green dashed/triangle); 20 ≤ r < 30″ (black solid/rhombus); 30 ≤ r < 40″ (blue dash dotted/inverted triangle); 40 ≤ r < 50″ (cyan long dashed/square). The magnitude limit corresponding to 50% of completeness are indicated in the plots. Completeness uncertainties are indicated in grey vertically (assumed as Poissonian), and typical magnitude uncertainties are indicated in grey horizontally.
Current usage metrics show cumulative count of Article Views (full-text article views including HTML views, PDF and ePub downloads, according to the available data) and Abstracts Views on Vision4Press platform.
Data correspond to usage on the plateform after 2015. The current usage metrics is available 48-96 hours after online publication and is updated daily on week days.
Initial download of the metrics may take a while.