Fig. 7
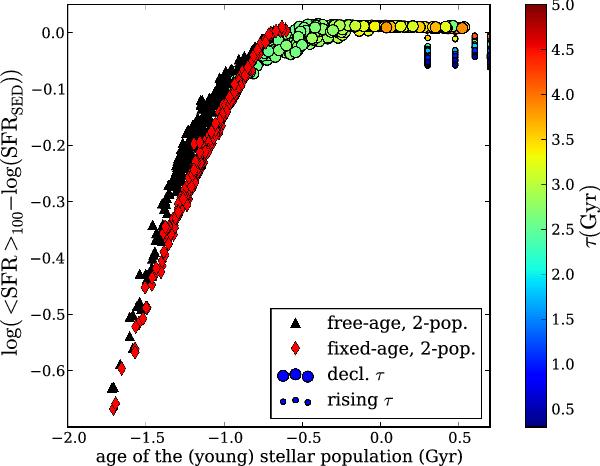
Difference between the SFR averaged over 100 Myr and the instantaneous one given by CIGALE plotted as a function of the age of the youngest stellar population (tf for the τ-models and tySP for the two-populations model). Triangles are for the two-populations model, small circles for the rising-τ model and large circles for the τ model. The absolute value of the decreasing rate τ is color coded for τ-models.
Current usage metrics show cumulative count of Article Views (full-text article views including HTML views, PDF and ePub downloads, according to the available data) and Abstracts Views on Vision4Press platform.
Data correspond to usage on the plateform after 2015. The current usage metrics is available 48-96 hours after online publication and is updated daily on week days.
Initial download of the metrics may take a while.