Fig. 4
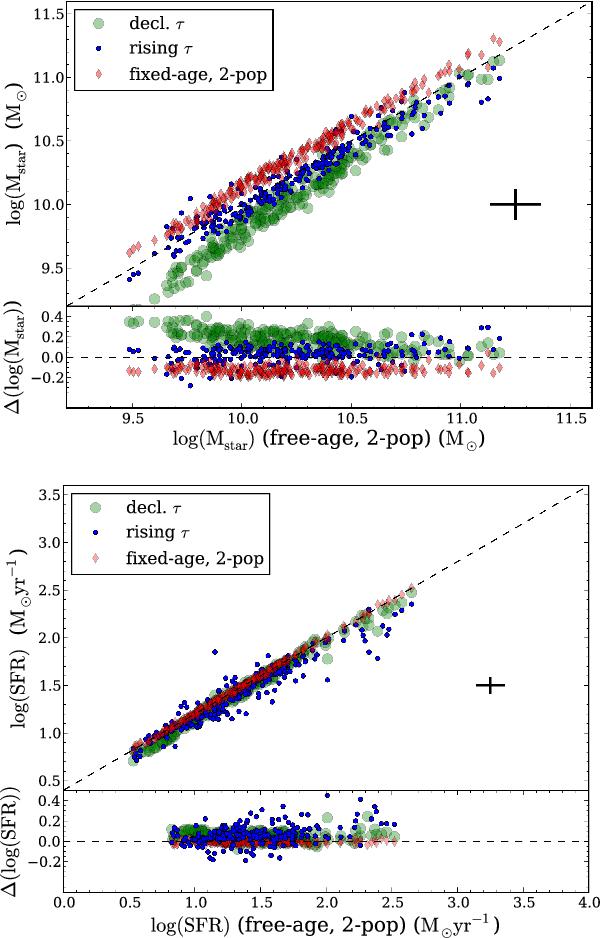
Comparison of Mstar (upper panel) and SFR (lower panel) determinations from the different models. The x-axis is from the baseline model (free-age 2-populations), the y-axis corresponds to free-age decl.-τ (green circles), fixed-age rising-τ (blue dots), and two-populations (red diamonds) models. Typical uncertainties on parameter estimations are indicated by a black cross. Δ(SFR) = Δ(log (SFR2pop) − log (SFRτ − model)) and Δ(Mstar) = Δ(log (Mstar−2pop) − log (Mstar−rising − τ)).
Current usage metrics show cumulative count of Article Views (full-text article views including HTML views, PDF and ePub downloads, according to the available data) and Abstracts Views on Vision4Press platform.
Data correspond to usage on the plateform after 2015. The current usage metrics is available 48-96 hours after online publication and is updated daily on week days.
Initial download of the metrics may take a while.