Fig. 12
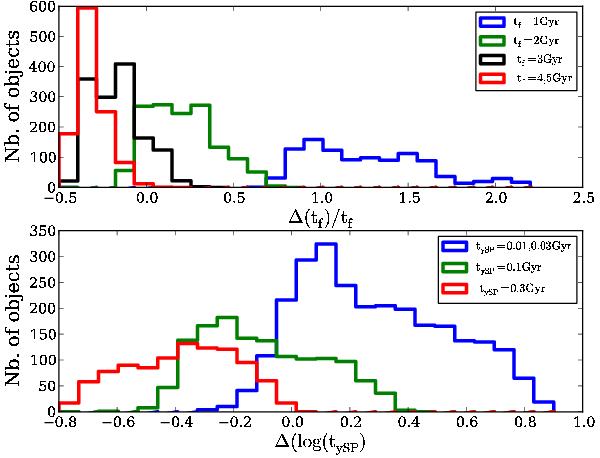
Upper panel: distribution of the relative difference between the estimated and true age of the old stellar population. The sample is split as a function of the true age: tf = 1 Gyr, tf = 2 Gyr, tf = 3 Gyr, and tf = 4, 5 Gyr. Lower panel: distribution of the ratio of the estimated and true age of the young stellar population in logarithmic units. The sample is split as a function of the true age: tySP = 0.01 Gyr, tySP = 0.03 Gyr, tySP = 0.1 Gyr, and tySP = 0.3 Gyr.
Current usage metrics show cumulative count of Article Views (full-text article views including HTML views, PDF and ePub downloads, according to the available data) and Abstracts Views on Vision4Press platform.
Data correspond to usage on the plateform after 2015. The current usage metrics is available 48-96 hours after online publication and is updated daily on week days.
Initial download of the metrics may take a while.