Fig. 11
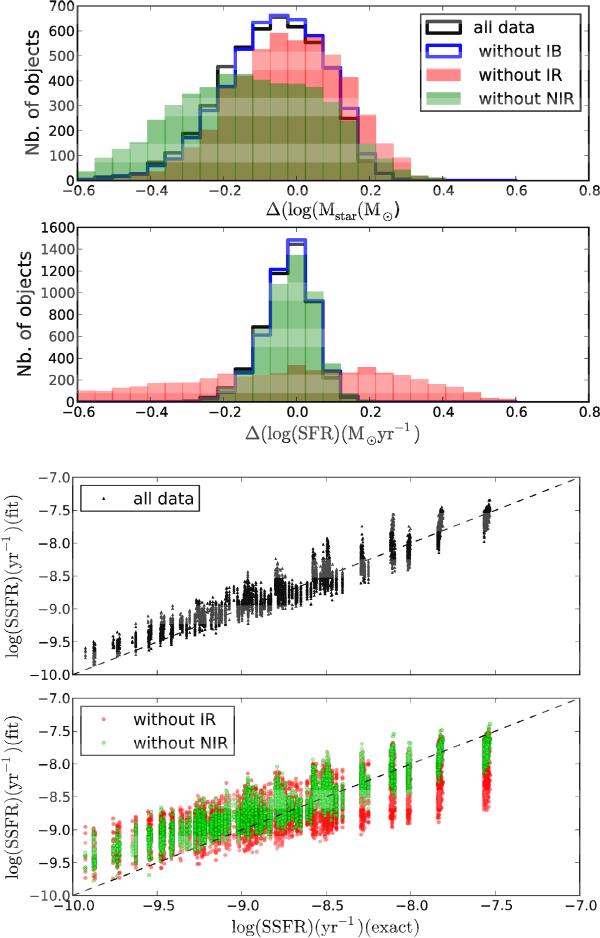
Upper panels: histogram of the difference between the estimated values of Mstar and SFR and the exact values from the mock catalogue. Black line: whole dataset, blue line: without IB data, green filled histogram: without NIR data, red filled histogram: without IR data, Lower panel: SSFR estimated with SED fitting are compared to the true values of the SSFR. Black point: whole dataset, green dots: without NIR data, red dots: without IR data. Results without IB are not shown since they are indistinguishable from those without IR data.
Current usage metrics show cumulative count of Article Views (full-text article views including HTML views, PDF and ePub downloads, according to the available data) and Abstracts Views on Vision4Press platform.
Data correspond to usage on the plateform after 2015. The current usage metrics is available 48-96 hours after online publication and is updated daily on week days.
Initial download of the metrics may take a while.