Fig. 10
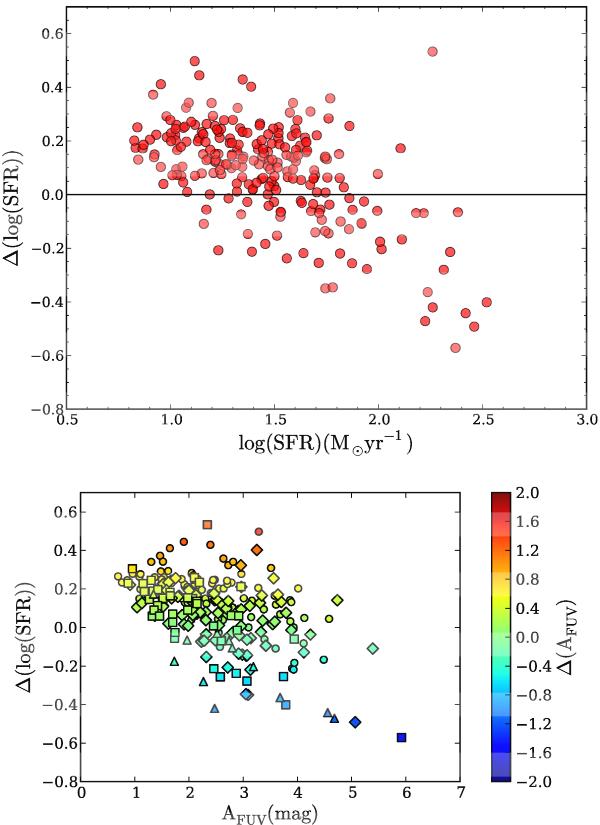
Difference in SFR estimates when IR data are omitted. Upper panel: the SFR reported on the x-axis is calculated with the whole dataset. The Δ(log (SFR)) on the y-axis is defined as the log (SFR) (with the reduced dataset)-log (SFR) (with the whole dataset). Lower panel: Δ(log (SFR)) as a function of AFUV measured with the full dataset. The difference between AFUV is color coded.
Current usage metrics show cumulative count of Article Views (full-text article views including HTML views, PDF and ePub downloads, according to the available data) and Abstracts Views on Vision4Press platform.
Data correspond to usage on the plateform after 2015. The current usage metrics is available 48-96 hours after online publication and is updated daily on week days.
Initial download of the metrics may take a while.