Free Access
Fig. 3
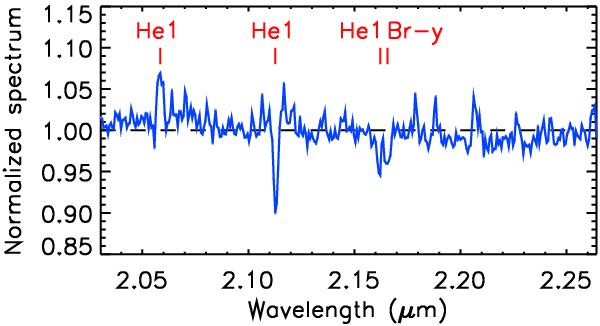
Calibrated spectrum of Vela X-1 measured with AMBER. The error bars are about the size of the line (typically 2%). The positions of the four identified spectral features are marked by solid red lines. The dashed black line denotes the normalized value of the spectrum.
Current usage metrics show cumulative count of Article Views (full-text article views including HTML views, PDF and ePub downloads, according to the available data) and Abstracts Views on Vision4Press platform.
Data correspond to usage on the plateform after 2015. The current usage metrics is available 48-96 hours after online publication and is updated daily on week days.
Initial download of the metrics may take a while.