Fig. 8
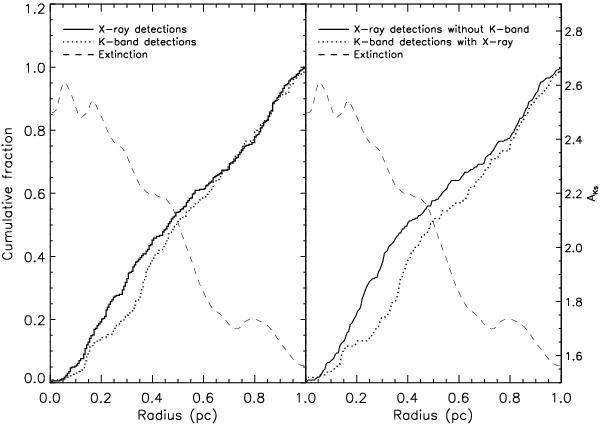
Cumulative radial distribution of the sources in the central parsec of W3 Main. The location of the center is chosen to be the position of IRS5. Left: the solid line shows the cumulative distribution of the X-ray sources of Feigelson & Townsley (2008) and the dotted line shows the distribution of the Ks-only catalog. Right: the solid line shows the distribution of the X-ray sources without Ks counterpart and the dotted line shows the cumulative distribution of the Ks-band sources matched with the X-ray catalog. The dashed line in both figures is the radial extinction profile derived from radially averaging the extinction map derived in Fig. 7.
Current usage metrics show cumulative count of Article Views (full-text article views including HTML views, PDF and ePub downloads, according to the available data) and Abstracts Views on Vision4Press platform.
Data correspond to usage on the plateform after 2015. The current usage metrics is available 48-96 hours after online publication and is updated daily on week days.
Initial download of the metrics may take a while.