Fig. 7
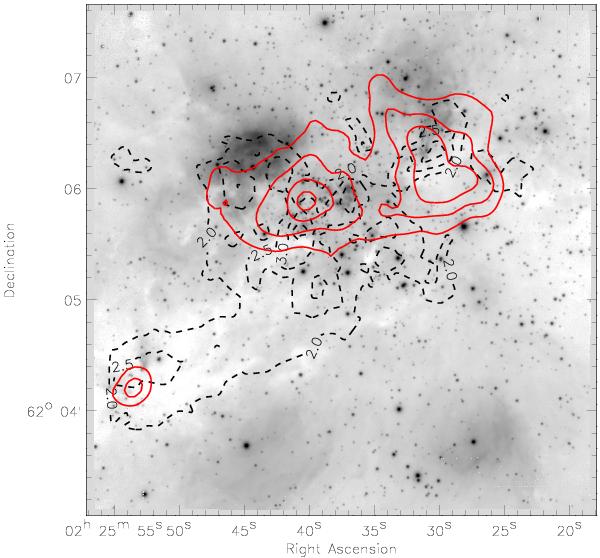
Extinction map toward W3 Main. The image shows the negative Ks-band image with logarithmic stretch. Overplotted in dashed black contours is the extinction map derived from the H − Ks colors of the stars using the extinction law of Nishiyama et al. (2009). Contours at AKs = 2, 2.5, 3.0 and 3.5 mag are shown. The red contours display 450 μm continuum emission observed by SCUBA (Ladd et al. 1993; Di Francesco et al. 2008), highlighting the location of the dense and cold dust. The contours of 10%, 20%, 40% and 80% of the maximum flux value (6.4 Jy/beam) are shown. The dust emission peaks around IRS5 and IRS4.
Current usage metrics show cumulative count of Article Views (full-text article views including HTML views, PDF and ePub downloads, according to the available data) and Abstracts Views on Vision4Press platform.
Data correspond to usage on the plateform after 2015. The current usage metrics is available 48-96 hours after online publication and is updated daily on week days.
Initial download of the metrics may take a while.