Fig. 4
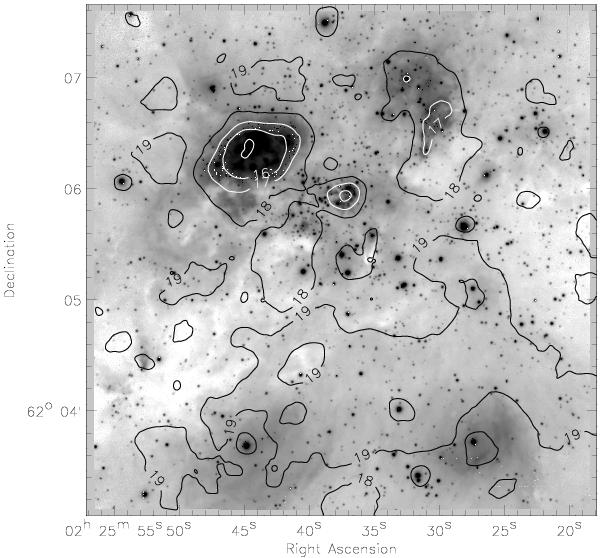
Map of the 50% completeness limits in Ks. Plotted in grayscale is the Ks-band image in logarithmic stretch. Overplotted as contours is the 50% completeness map as derived from the artificial star experiments. The values are indicated with the contour levels. The white contour levels mark the lowest completeness magnitudes: Ks = 15, 16, 17 mag. The 50% completeness ranges from Ks = 19 mag in the southern part of the region to Ks = 15 mag toward W3A, demonstrating a dramatic change in photometric completeness.
Current usage metrics show cumulative count of Article Views (full-text article views including HTML views, PDF and ePub downloads, according to the available data) and Abstracts Views on Vision4Press platform.
Data correspond to usage on the plateform after 2015. The current usage metrics is available 48-96 hours after online publication and is updated daily on week days.
Initial download of the metrics may take a while.