Fig. 2
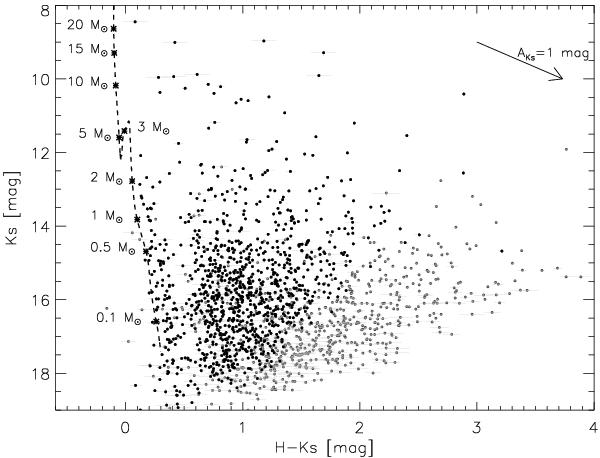
H − Ks vs. Ks color–magnitude diagram of W3 Main. The gray data points represent the sources detected in H and Ks, while the black data points are the sources detected in JHKs. The very red sources are not detected anymore in the J-band due to their high-extinction which affects the detection in the J-band the strongest. Only sources with magnitude errors less than 0.1 mag are plotted. Overplotted is the extinction vector for AKs = 1 mag from the extinction law of Nishiyama et al. (2009). The dashed line shows the combined main sequence and PMS isochrone of 2 Myr for a distance of 2 kpc. Above 5 M⊙, the main sequence models of Brott et al. (2011) with vrot = 0 are used, while for lower masses the models have been calculated by Tognelli et al. (2011).
Current usage metrics show cumulative count of Article Views (full-text article views including HTML views, PDF and ePub downloads, according to the available data) and Abstracts Views on Vision4Press platform.
Data correspond to usage on the plateform after 2015. The current usage metrics is available 48-96 hours after online publication and is updated daily on week days.
Initial download of the metrics may take a while.