Fig. 12
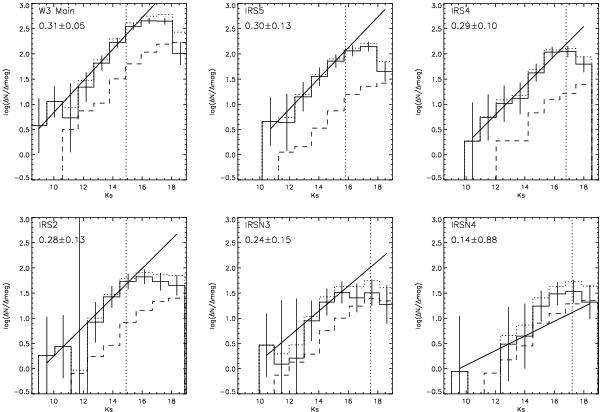
Ks-band luminosity functions for the entire W3 Main region and the different subregions constructed from only the Ks-detected sources. The dotted histograms are the observed sources binned with a bin size of 1 mag. The dashed histograms represent the histogram of the stars in the control field, scaled to the area of the corresponding subregion. The field-corrected histogram is plotted with a solid line. The vertical dotted lines represent the magnitude above which we are photometrically complete with a completeness of at least 50%. A linear fit yields the slopes indicated in the figures.
Current usage metrics show cumulative count of Article Views (full-text article views including HTML views, PDF and ePub downloads, according to the available data) and Abstracts Views on Vision4Press platform.
Data correspond to usage on the plateform after 2015. The current usage metrics is available 48-96 hours after online publication and is updated daily on week days.
Initial download of the metrics may take a while.