Fig. 8
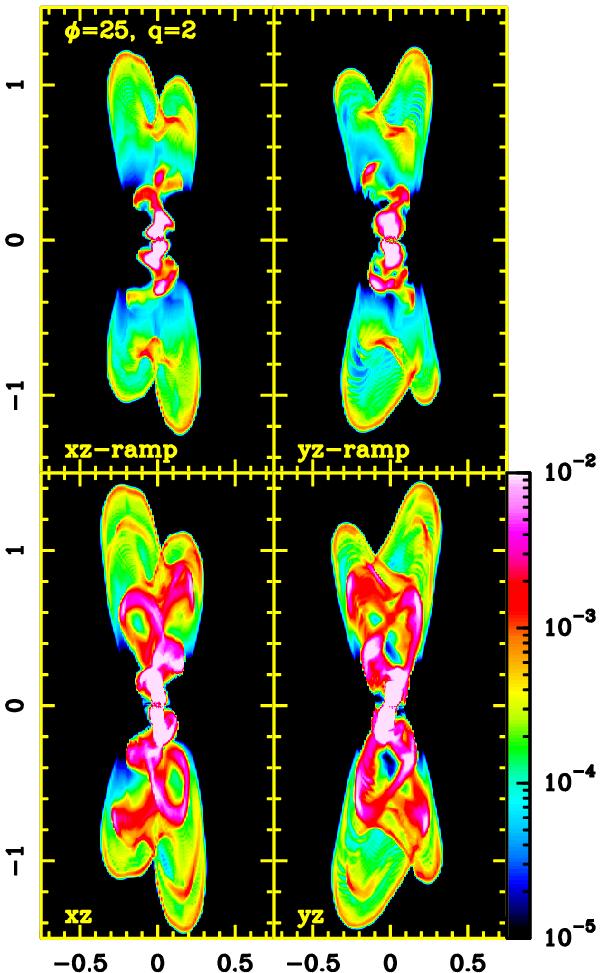
Synthetic [S ii] emission maps obtained from models M1a (bottom panels) and M1b (top panels). The right panels display the yz projection for both models, while the left panels display the xz projection. The angle between the precession axis and the plane of sky was set to 25° for all models. The vertical color bar gives the [S ii] flux in units of erg s-1cm-2sr-1. The vertical and horizontal axes are given in units of 1017 cm.
Current usage metrics show cumulative count of Article Views (full-text article views including HTML views, PDF and ePub downloads, according to the available data) and Abstracts Views on Vision4Press platform.
Data correspond to usage on the plateform after 2015. The current usage metrics is available 48-96 hours after online publication and is updated daily on week days.
Initial download of the metrics may take a while.