Fig. 2
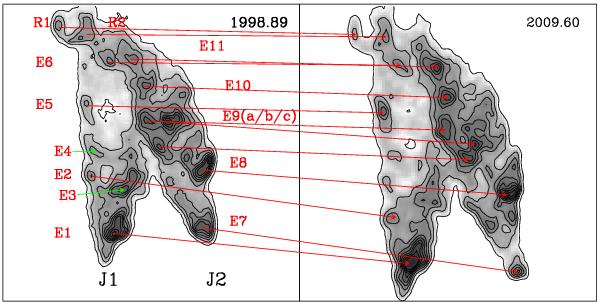
Bright (east) lobe in the 1998.89 (left) and 2009.60 (right) [S ii] images. Several features along regions J1 and J2 are marked and labeled. Changes in the structure of the labeled features between both epochs are discussed in the text. The red arrows show the assumed identifications of corresponding knot pairs in the two epochs.
Current usage metrics show cumulative count of Article Views (full-text article views including HTML views, PDF and ePub downloads, according to the available data) and Abstracts Views on Vision4Press platform.
Data correspond to usage on the plateform after 2015. The current usage metrics is available 48-96 hours after online publication and is updated daily on week days.
Initial download of the metrics may take a while.