Fig. 12
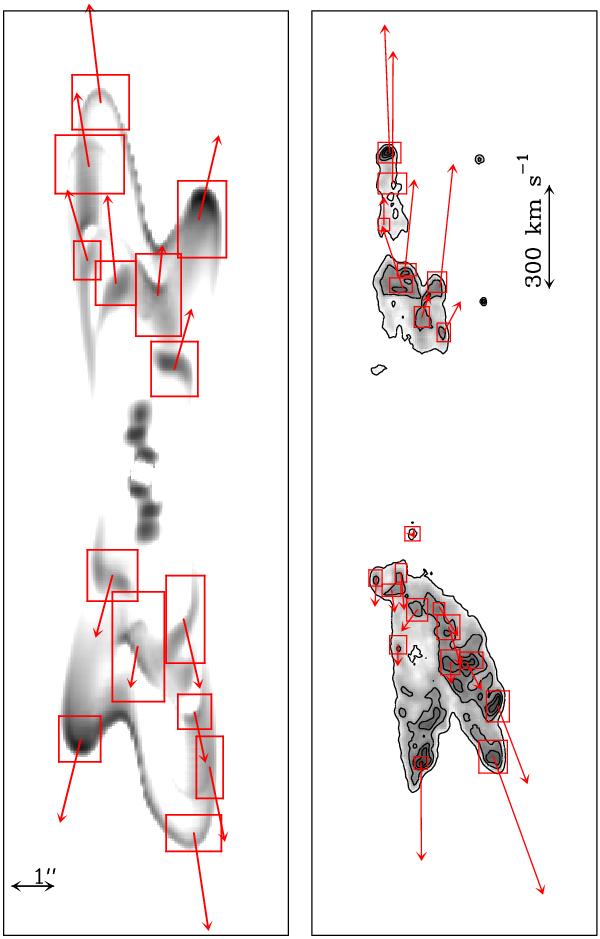
Left panel: proper motions of the individual features in the synthetic [S ii] map (model M2b) together with the boxes in which the cross-correlations were made. The red arrows show the computed proper motions. The length of each arrow is proportional to the proper motion. Right panel: proper motions of the individual knots of CRL 618, included for comparison. Both images are shown to the same spatial scale. The vertical arrow at the top right shows a proper motion of 300 km s-1.
Current usage metrics show cumulative count of Article Views (full-text article views including HTML views, PDF and ePub downloads, according to the available data) and Abstracts Views on Vision4Press platform.
Data correspond to usage on the plateform after 2015. The current usage metrics is available 48-96 hours after online publication and is updated daily on week days.
Initial download of the metrics may take a while.