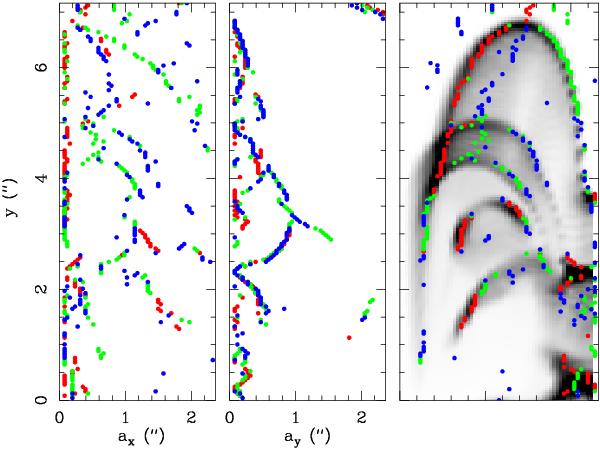
Fig. 11

Wavelet study performed on the top-left lobe or jet of the model M2b. The [S ii] image obtained from this model at a t = 120 yr integration time is shown in the right panel. For each y, the location of the three maxima of the intensity map are shown as dots superimposed on this image (first maximum in red, second maximum in green and third maximum in blue). The characteristic sizes (ax,k in the left panel; ay,k in the central panel) are shown as a function of position y along the jet axis.
Current usage metrics show cumulative count of Article Views (full-text article views including HTML views, PDF and ePub downloads, according to the available data) and Abstracts Views on Vision4Press platform.
Data correspond to usage on the plateform after 2015. The current usage metrics is available 48-96 hours after online publication and is updated daily on week days.
Initial download of the metrics may take a while.


