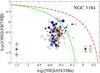
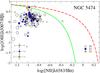
Fig. 7
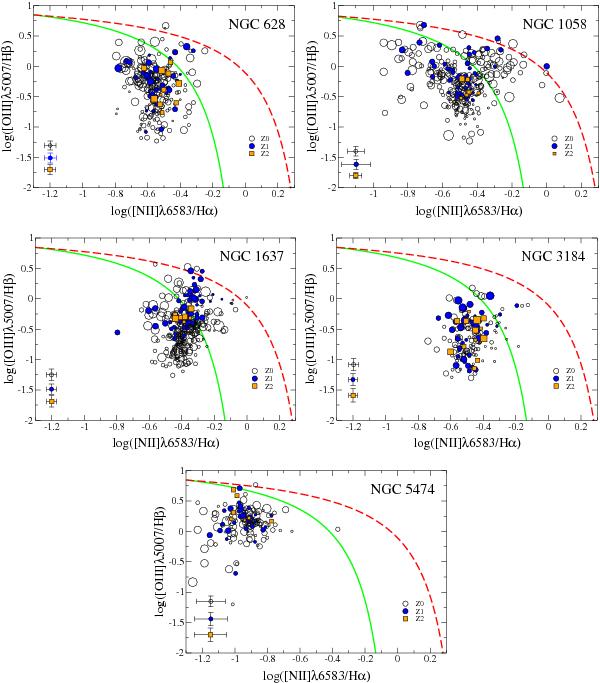
Classical BPT emission-line diagnostic diagrams (Baldwin et al. 1981; Veilleux & Osterbrock 1987) with the demarcation curves of Kewley et al. (2001) (upper curve, red) and Kauffmann et al. (2003) (lower curve, green) for each galaxy. Empty circles correspond to Z0, blue circles to Z1, and orange squares to Z2. Symbol sizes are proportional to galactocentric distance, i.e. the larger symbols are, the farther from the centre.
Current usage metrics show cumulative count of Article Views (full-text article views including HTML views, PDF and ePub downloads, according to the available data) and Abstracts Views on Vision4Press platform.
Data correspond to usage on the plateform after 2015. The current usage metrics is available 48-96 hours after online publication and is updated daily on week days.
Initial download of the metrics may take a while.