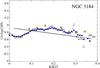
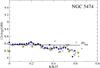
Fig. B.1
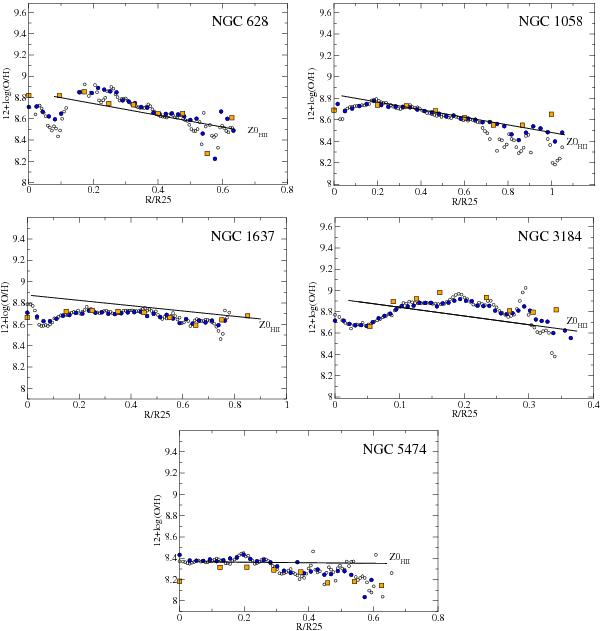
Radial abundance gradients for all the sample, using the annular binning scheme for the spectral extraction. On each redshift regime annuli are one pixel wide (on its corresponding scale). In each panel the three redshift regimes are over-plotted, the empty circles correspond to Z0, the blue circles to Z1, and the orange squares to Z2 as usual. The black line indicates the Z0 abundance gradient determined in Sect. 5.2.3.
Current usage metrics show cumulative count of Article Views (full-text article views including HTML views, PDF and ePub downloads, according to the available data) and Abstracts Views on Vision4Press platform.
Data correspond to usage on the plateform after 2015. The current usage metrics is available 48-96 hours after online publication and is updated daily on week days.
Initial download of the metrics may take a while.