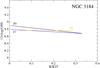
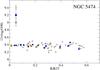
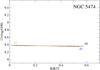
Fig. A.1
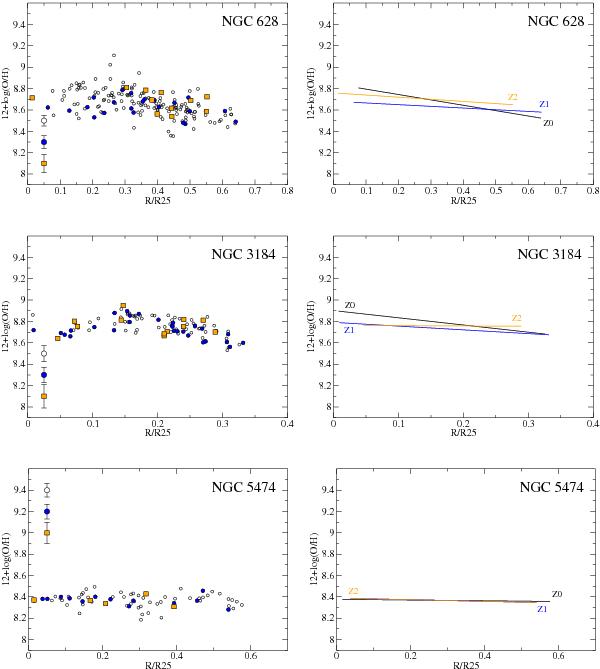
Radial abundance gradients derived using the relation O3N2 from Pettini & Pagel (2004) for the three remaining galaxies. In each left panel the three redshift regimes are over-plotted, the empty circles correspond to Z0, the blue circles to Z1, and the orange squares to Z2. The three points in the lower left corner (upper left for NGC 5474) show the average error bars. In the right panels we can see a linear regression fitting to each regime.
Current usage metrics show cumulative count of Article Views (full-text article views including HTML views, PDF and ePub downloads, according to the available data) and Abstracts Views on Vision4Press platform.
Data correspond to usage on the plateform after 2015. The current usage metrics is available 48-96 hours after online publication and is updated daily on week days.
Initial download of the metrics may take a while.