Free Access
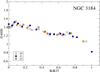
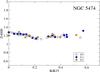
Fig. 14
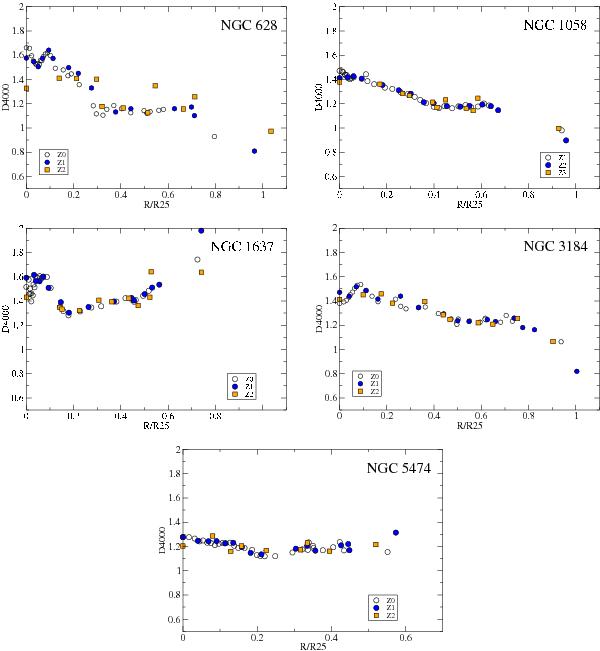
Radial distribution of the D4000 index defined as the ratio of the flux in the red continuum to that in the blue continuum. Black empty circles correspond to Z0 regime, blue circles to Z1, and orange squares to Z2. The error bars are similar to the symbol sizes.
This figure is made of several images, please see below:
Current usage metrics show cumulative count of Article Views (full-text article views including HTML views, PDF and ePub downloads, according to the available data) and Abstracts Views on Vision4Press platform.
Data correspond to usage on the plateform after 2015. The current usage metrics is available 48-96 hours after online publication and is updated daily on week days.
Initial download of the metrics may take a while.