Fig. 11
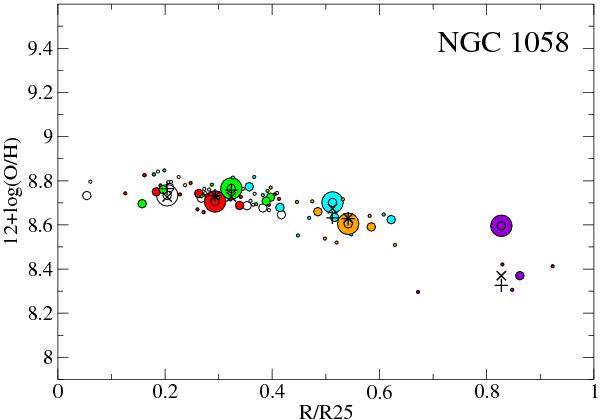
Radial abundance gradient of NGC 1058 for the three redshift regimes. Colour coded is each different Z2 region with its corresponding Z0 and Z1 components (same colour). Small circles correspond to Z0, medium sized to Z1 and the bigger ones to Z2. Plus signs represent the abundance determined summing the flux of all the Z0 regions inside the corresponding Z2 region, while crosses are the determination from the total flux of Z1 regions (also the ones inside the Z2 region).
Current usage metrics show cumulative count of Article Views (full-text article views including HTML views, PDF and ePub downloads, according to the available data) and Abstracts Views on Vision4Press platform.
Data correspond to usage on the plateform after 2015. The current usage metrics is available 48-96 hours after online publication and is updated daily on week days.
Initial download of the metrics may take a while.