Fig. 8
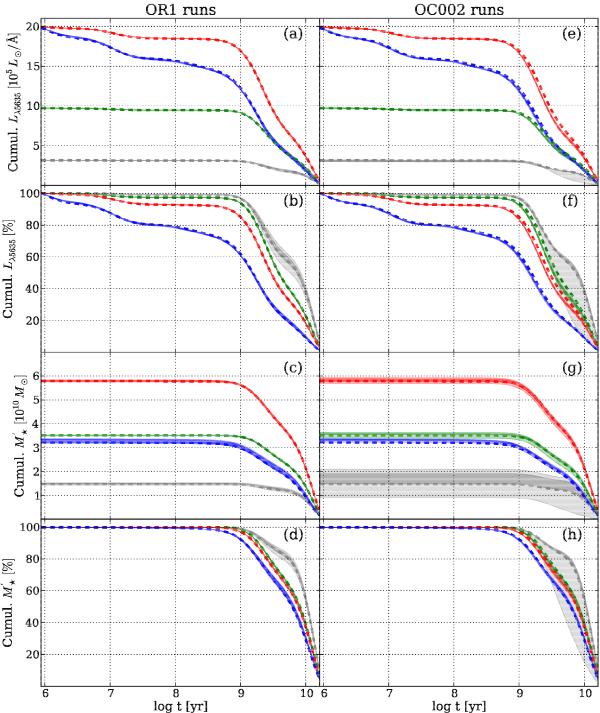
Spatially averaged cumulative light and mass histories and their uncertainties for four regions: red, blue, green and grey colors correspond to regions R > 1, R < 1, R < 0.5 HLR and the nucleus, respectively. Left and right panels show OR1 and OC002 simulations, respectively. The top four panels show cumulative light distributions, in both absolute (a), e)) and relative (b), f)) units. Similarly, the bottom four panels show the correponding mass distributions. In each panel and for each radial region the original solution is drawn as a dashed line, while results of the simulations are shown with shaded bands, hardly visible except for the nuclear curves (grey). Light shaded bands show the ranges spanned by all 10 perturbations, and darker shades indicate the range spanned by the 6 versions closer to the median. The nuclear curves in panels a), c), e) and g) contain much less light and mass than the others, and so were multiplied by 20 for clarity.
Current usage metrics show cumulative count of Article Views (full-text article views including HTML views, PDF and ePub downloads, according to the available data) and Abstracts Views on Vision4Press platform.
Data correspond to usage on the plateform after 2015. The current usage metrics is available 48-96 hours after online publication and is updated daily on week days.
Initial download of the metrics may take a while.