Fig. 7
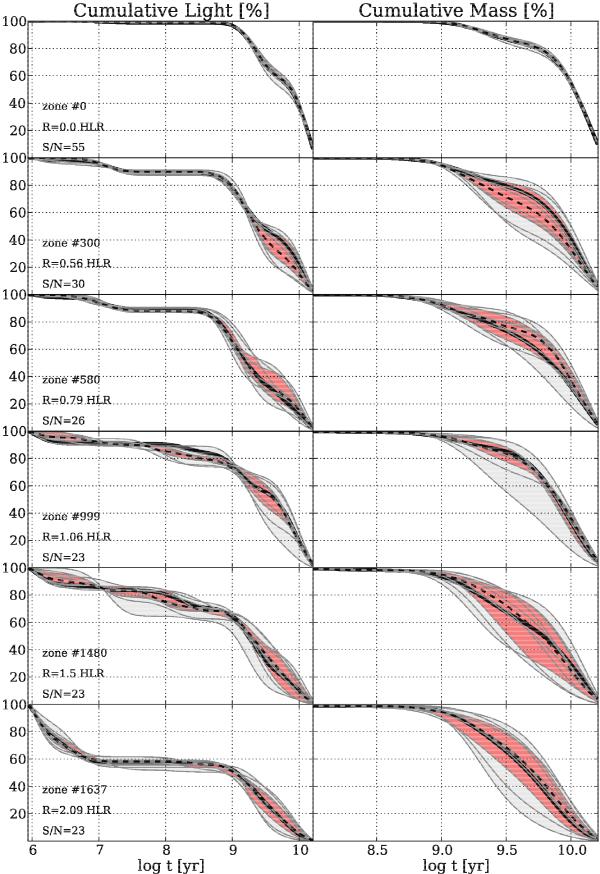
SFHs of six different spatial zones, as represented by their cumulative light (left) and mass (right) distributions. Each panel shows 11 SFHs. The original one is plotted in thick black lines. Gray lines show the SFHs for the ten realizations of OR1 simulations, with a gray-shaded band tracing the full range of values. The median SFH is drawn as a dashed line, while the red band marks the range spanned by the six runs closer to the median. The zone number, distance to the nucleus, and the S/N are labeled in the left panels.
Current usage metrics show cumulative count of Article Views (full-text article views including HTML views, PDF and ePub downloads, according to the available data) and Abstracts Views on Vision4Press platform.
Data correspond to usage on the plateform after 2015. The current usage metrics is available 48-96 hours after online publication and is updated daily on week days.
Initial download of the metrics may take a while.