Fig. 4
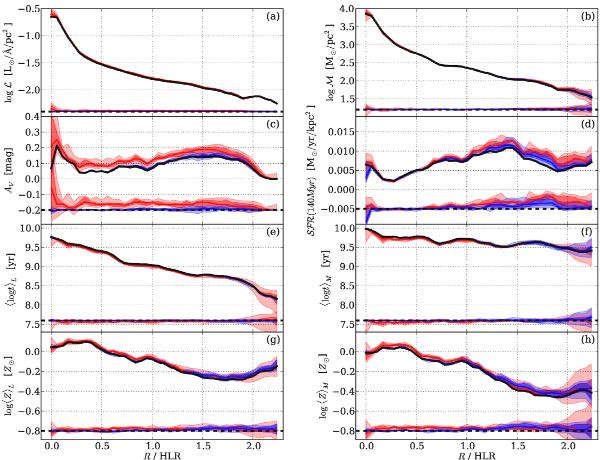
Azimuthally averaged radial profiles of some global properties. a) Dereddened luminosity surface density at 5635 Å; b) stellar mass surface density; c) extinction; d) SFR surface density over the last 140 Myr; e) luminosity and f) mass-weighted mean log ages; g) luminosity and h) mass weighted mean metallicities. The original solution is shown as the solid black line, while those obtained from simulations are shown in colored shades. Light-blue shades show the full range of values found among the ten realizations of random noise (OR1 runs). The darker blue bands mark the range spanned by the six values closer to the median (marked with the blue solid line). OC002 simulations of color-change effects are plotted in red. The differences between the simulations and original profiles are shown at the bottom of each panel, with the zero level indicated by the dashed black line. The dispersion and offsets along these difference profiles give a measure of the uncertainties and biases involved in the radial profiles.
Current usage metrics show cumulative count of Article Views (full-text article views including HTML views, PDF and ePub downloads, according to the available data) and Abstracts Views on Vision4Press platform.
Data correspond to usage on the plateform after 2015. The current usage metrics is available 48-96 hours after online publication and is updated daily on week days.
Initial download of the metrics may take a while.