Free Access
Fig. 3
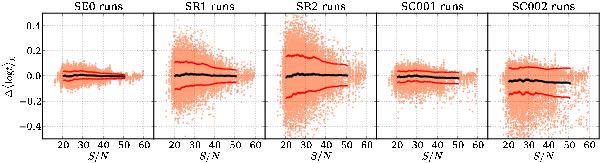
Δ ⟨log t⟩L variations for all 1638 zones × 10 realizations plotted against the S/N of the corresponding original (observed) spectra. The different panels correspond to different sets of simulations, as labeled. The lines are the running mean of Δ ⟨log t⟩L and the corresponding ± 1σ intervals.
Current usage metrics show cumulative count of Article Views (full-text article views including HTML views, PDF and ePub downloads, according to the available data) and Abstracts Views on Vision4Press platform.
Data correspond to usage on the plateform after 2015. The current usage metrics is available 48-96 hours after online publication and is updated daily on week days.
Initial download of the metrics may take a while.