Fig. 13
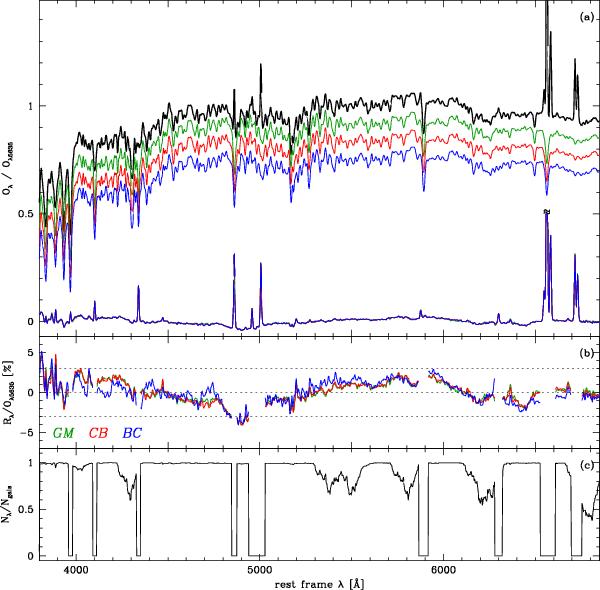
a) Black line: mean (stacked) normalized spectrum of 98291 zones from 107 CALIFA galaxies, obtained by averaging Oλ/Oλ5635. Green, red, and blue lines (offset for clarity): mean synthetic spectra for bases GM, CB, and BC, respectively. The corresponding (Oλ − Mλ)/Oλ5635 residual spectra are shown with the same colors, but they are hardly distinguishable. b) Zoom of the spectral residuals in the top panel, with emission lines removed for clarity. Dashed lines mark residuals of − 3, 0, and + 3%. c) Fraction of the 98291 zones contributing to the spectral statistics in the midde panel.
Current usage metrics show cumulative count of Article Views (full-text article views including HTML views, PDF and ePub downloads, according to the available data) and Abstracts Views on Vision4Press platform.
Data correspond to usage on the plateform after 2015. The current usage metrics is available 48-96 hours after online publication and is updated daily on week days.
Initial download of the metrics may take a while.