Fig. 12
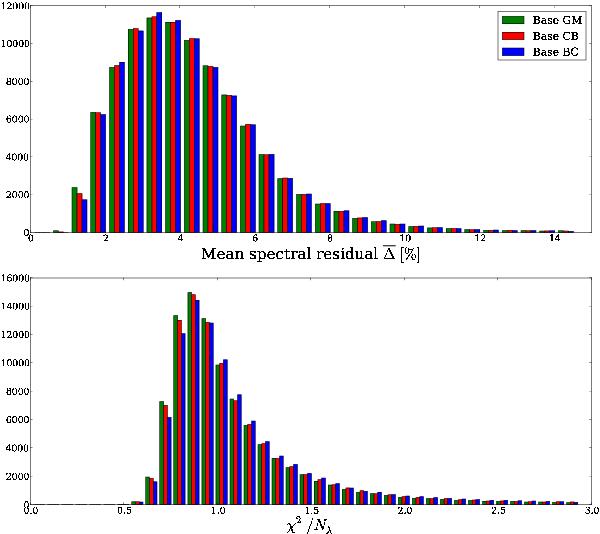
Top: distribution of the mean percentual spectral deviation for starlight fits with the GM (bars in green), CB (red) and BC (blue) bases. Bottom: as above, but for the distribution of χ2 per fitted flux. In both cases the distributions are essentially identical, reflecting the fact that the three bases provide equally good spectral fits.
Current usage metrics show cumulative count of Article Views (full-text article views including HTML views, PDF and ePub downloads, according to the available data) and Abstracts Views on Vision4Press platform.
Data correspond to usage on the plateform after 2015. The current usage metrics is available 48-96 hours after online publication and is updated daily on week days.
Initial download of the metrics may take a while.