Fig. 11
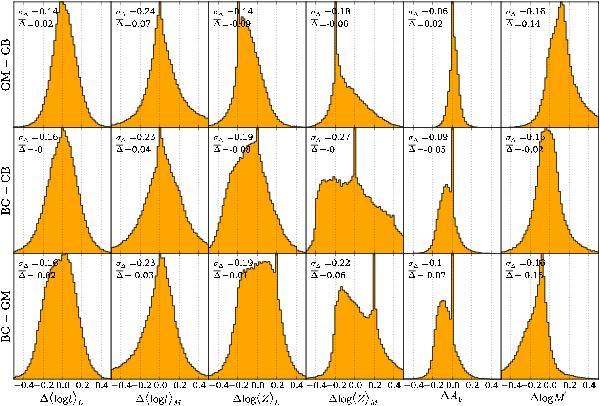
Histograms of differences in global properties obtained with bases GM, CB and BC. Δs are defined as GM − CB in the top panels, BC − CB in the middle, and BC − GM in the bottom ones. The horizontal scale is the same as in Fig. 1 to facilitate the comparison of data- and method-related uncertainties with the model-related ones.
Current usage metrics show cumulative count of Article Views (full-text article views including HTML views, PDF and ePub downloads, according to the available data) and Abstracts Views on Vision4Press platform.
Data correspond to usage on the plateform after 2015. The current usage metrics is available 48-96 hours after online publication and is updated daily on week days.
Initial download of the metrics may take a while.