Fig. 1
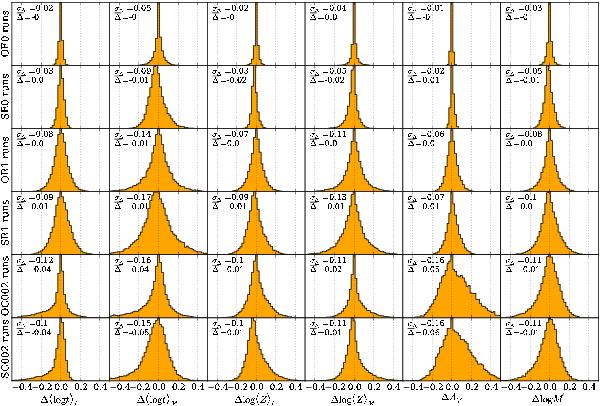
Histograms of Δ (≡simulated minus original value) for the main scalar properties derived from the spectral synthesis: ⟨log t⟩L, ⟨log t⟩M, log ⟨Z⟩L, log ⟨Z⟩M, AV and the initial stellar mass formed (log M′). Each row corresponds to one set of simulations, alternating S and O runs (as labeled in the y-axis). Mean Δs and their σs are labeled in each panel. Except for the AV column, each histogram is based on 16 380 values obtained from the 1638 zones in CALIFA 277 and ten Monte Carlo realizations of the perturbation. For clarity, the AV histograms were drawn excluding the many ΔAV = 0 cases, which occur due to the AV ≥ 0 physical limit imposed on the spectral fits. Noise-free simulations (OE0 and SE0), which trace intrinsic degeneracies in spectral fits of composite stellar populations, are shown in the top two rows. Random-noise simulations (SR1 and OR1, central rows) map the uncertainties caused by statistical fluctuations of the observed Fλ fluxes. C002-simulations, where the spectral-shape is changed to emulate calibration uncertainties, are shown in the bottom panels.
Current usage metrics show cumulative count of Article Views (full-text article views including HTML views, PDF and ePub downloads, according to the available data) and Abstracts Views on Vision4Press platform.
Data correspond to usage on the plateform after 2015. The current usage metrics is available 48-96 hours after online publication and is updated daily on week days.
Initial download of the metrics may take a while.