Fig. 8
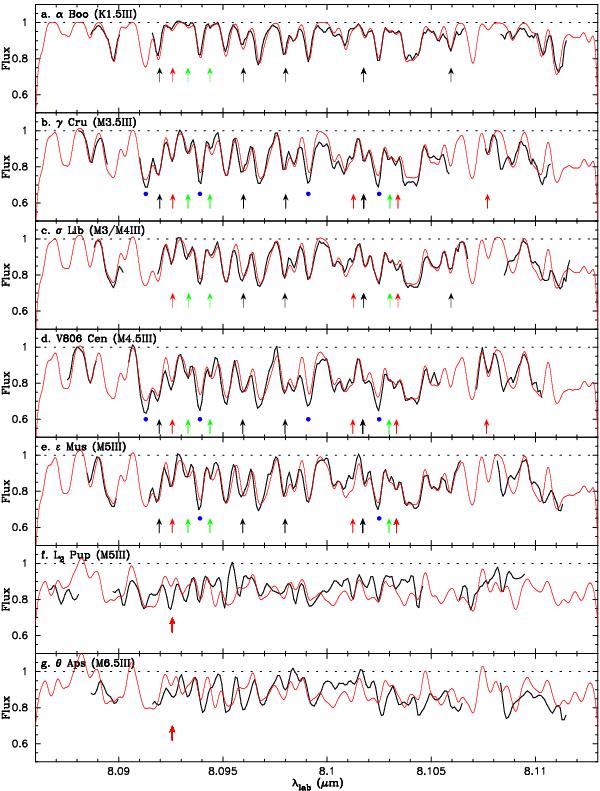
Comparison of the synthetic spectra based on the MARCS models with the observed VISIR spectra of seven K–M giants. The observed and synthetic spectra are shown by the black and red solid lines, respectively. The relatively isolated 28SiO, 29SiO, and 30SiO lines are marked by the black, red, and green arrows, respectively. See Fig. 1 for their identification. The 28SiO lines with absorption excess are marked by the blue dots.
Current usage metrics show cumulative count of Article Views (full-text article views including HTML views, PDF and ePub downloads, according to the available data) and Abstracts Views on Vision4Press platform.
Data correspond to usage on the plateform after 2015. The current usage metrics is available 48-96 hours after online publication and is updated daily on week days.
Initial download of the metrics may take a while.