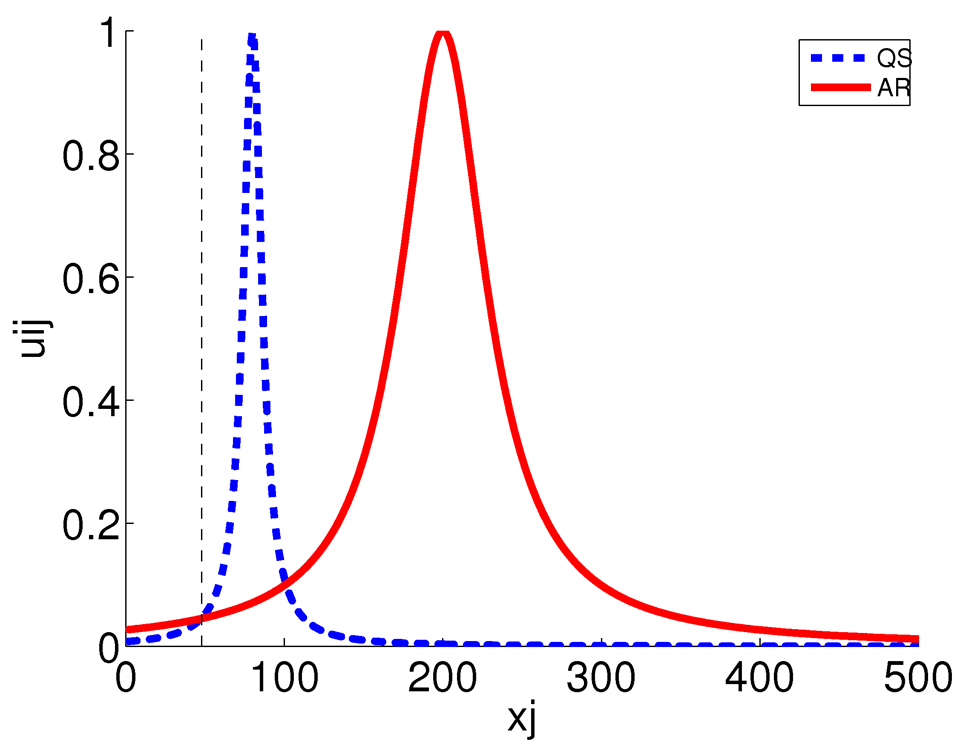
Fig. 3
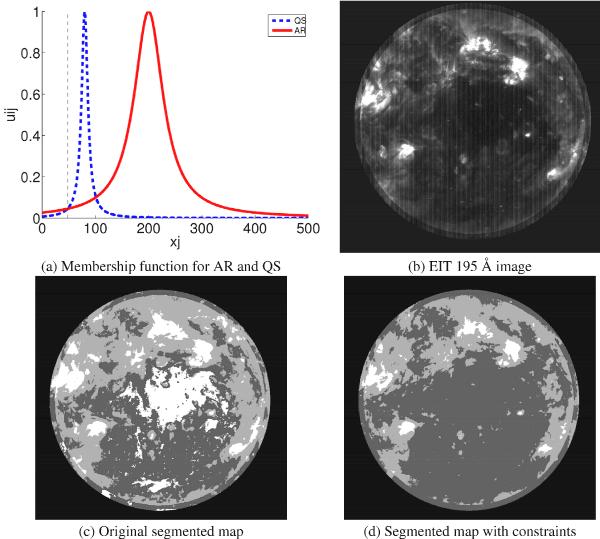
a) Illustration of membership functions uij for AR and QS feature vectors xj in the case of a large value of ηAR. Because of the larger spread in intensity values of the AR, small values of xj may have a larger AR membership than QS membership. b) EIT 195 Å image from January 1, 2000 with limb brightness correction. c) Segmentation using original PCM algorithm: The darkest parts are classified as active regions. d) Segmentation using PCM with constraints on ηi-values.


Current usage metrics show cumulative count of Article Views (full-text article views including HTML views, PDF and ePub downloads, according to the available data) and Abstracts Views on Vision4Press platform.
Data correspond to usage on the plateform after 2015. The current usage metrics is available 48-96 hours after online publication and is updated daily on week days.
Initial download of the metrics may take a while.