Free Access
Fig. 14
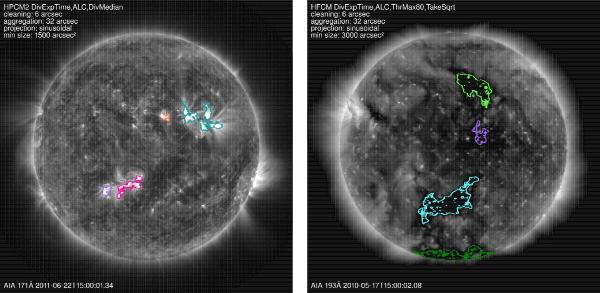
a) (left) Overlay of an AR map created using AIA 171 and 193 Å onto the corresponding AIA 171 Å image taken on June 22, 2011 around 15h UT. b) (right) Overlay of a CH map created using AIA 193 Å onto the corresponding AIA 193 Å image taken on May 17, 2010 around 15h UT.
Current usage metrics show cumulative count of Article Views (full-text article views including HTML views, PDF and ePub downloads, according to the available data) and Abstracts Views on Vision4Press platform.
Data correspond to usage on the plateform after 2015. The current usage metrics is available 48-96 hours after online publication and is updated daily on week days.
Initial download of the metrics may take a while.