Free Access
Fig. 12
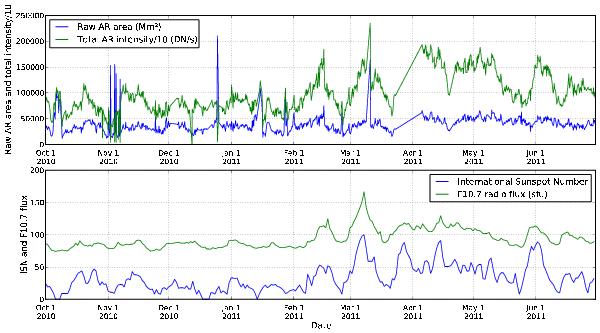
a) (top) Raw AR area and total AR intensity from 174 Å SWAP images; and b) (bottom) Daily International Sunspot Number and F10.7 radio flux from October 1, 2010 to June 30, 2011.
Current usage metrics show cumulative count of Article Views (full-text article views including HTML views, PDF and ePub downloads, according to the available data) and Abstracts Views on Vision4Press platform.
Data correspond to usage on the plateform after 2015. The current usage metrics is available 48-96 hours after online publication and is updated daily on week days.
Initial download of the metrics may take a while.