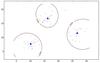
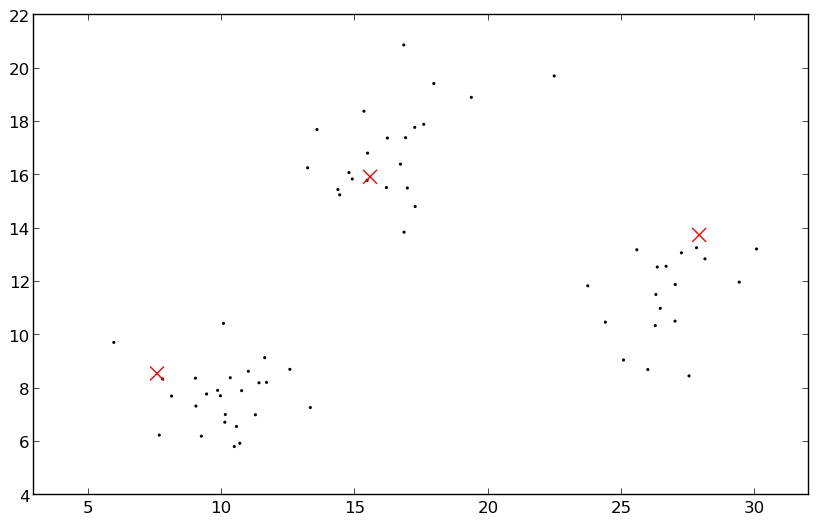
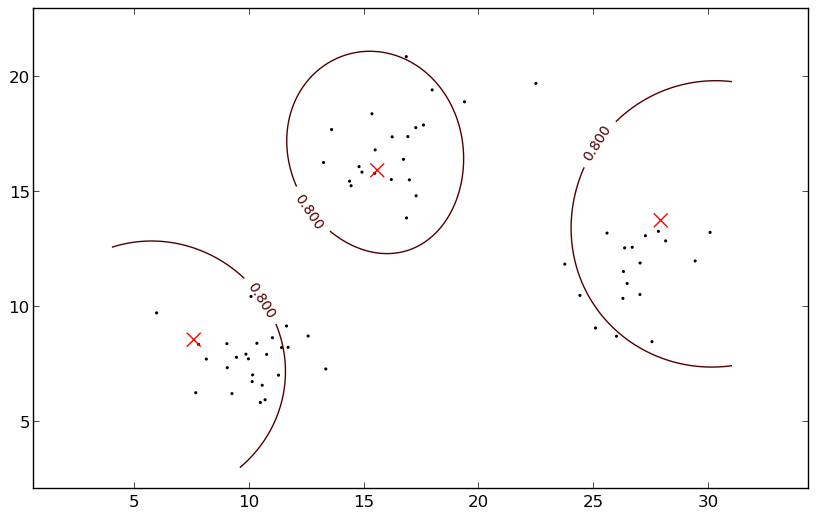
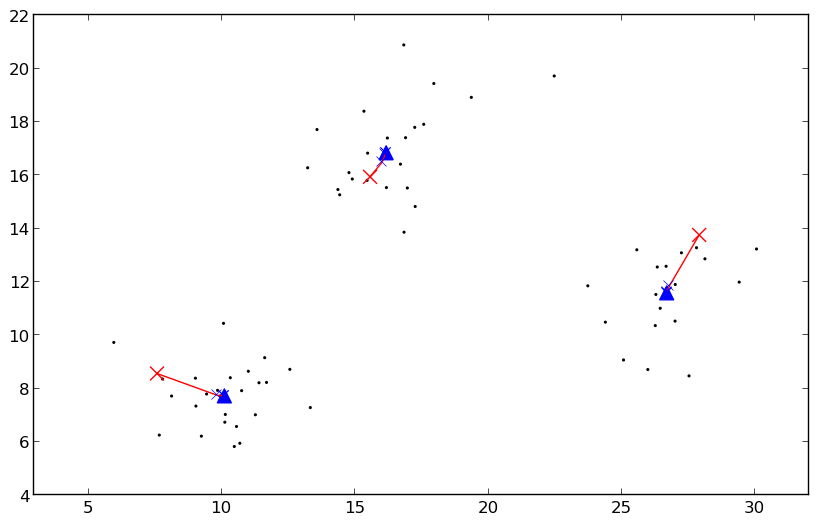
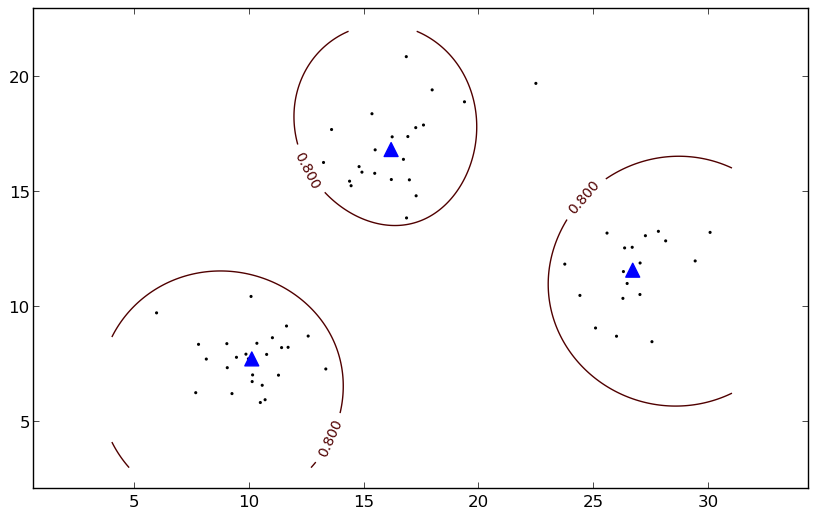
Fig. 1
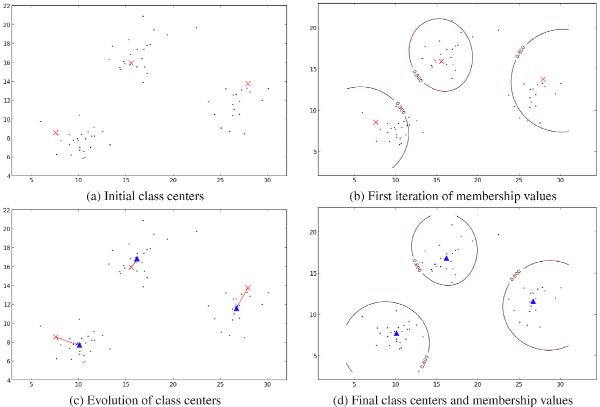
Illustration of several steps in the iterative procedure of FCM on a simple synthetic 2D dataset containing three clusters of data points. a) An initial center (red cross) is chosen for every class. b) In a first iteration, the membership values for every data point are calculated, considering the class centers. The contours delineate a membership value of 0.8. c) In a next step, the new class centers are calculated, considering the new membership values. After seven such two-step iterations, the class centers have converged to their final values, indicated by the blue triangles. d) In the last step, the final membership values are calculated, considering the final class centers. Note that both the final position of the centers and the final membership contours correspond much better to the three clusters than the initial ones.
Current usage metrics show cumulative count of Article Views (full-text article views including HTML views, PDF and ePub downloads, according to the available data) and Abstracts Views on Vision4Press platform.
Data correspond to usage on the plateform after 2015. The current usage metrics is available 48-96 hours after online publication and is updated daily on week days.
Initial download of the metrics may take a while.