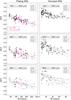
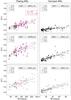
Fig. 8

Frequency averages of the fractional differences in mode amplitude (left two columns) and mode width (right two columns) for flaring (left) and dormant (right) ARs as a function of the magnetic-activity index difference (δB = BAR − BQR) of the AR and the corresponding QR. Red and magenta symbols correspond to the ARs flare(s) of magnitude (m) > X3 and X1 ≤ m ≤ X3, respectively. The solid lines show the linear regression fit, while dashed curves show 90% confidence level of the linear fit. Note that the mode parameters are corrected for the foreshortening and duty cycles. (This figure is available in color in electronic form.)
Current usage metrics show cumulative count of Article Views (full-text article views including HTML views, PDF and ePub downloads, according to the available data) and Abstracts Views on Vision4Press platform.
Data correspond to usage on the plateform after 2015. The current usage metrics is available 48-96 hours after online publication and is updated daily on week days.
Initial download of the metrics may take a while.