Fig. 9
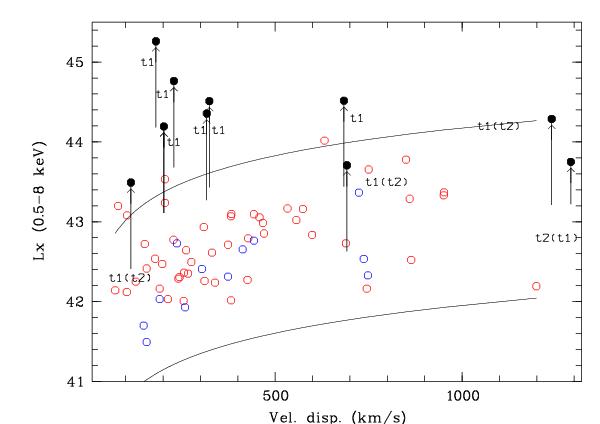
X-ray luminosity as a function of galaxy velocity dispersion. Open circles are from Connelly et al. (2012), red: X-ray selected groups, blue: optically selected groups. The two black curves show the 3σ envelope of the Connelly et al. (2012) X-ray selected sample. The black filled circles correspond to our detected substructures. The lower extremities of the vertical lines show the places of the infalling structures prior to their dynamical capture assuming the epoch written next to the lines. Other epochs written in parentheses are also possible to place the infalling structures inside the Connelly et al. (2012) envelope.
Current usage metrics show cumulative count of Article Views (full-text article views including HTML views, PDF and ePub downloads, according to the available data) and Abstracts Views on Vision4Press platform.
Data correspond to usage on the plateform after 2015. The current usage metrics is available 48-96 hours after online publication and is updated daily on week days.
Initial download of the metrics may take a while.