Fig. 7
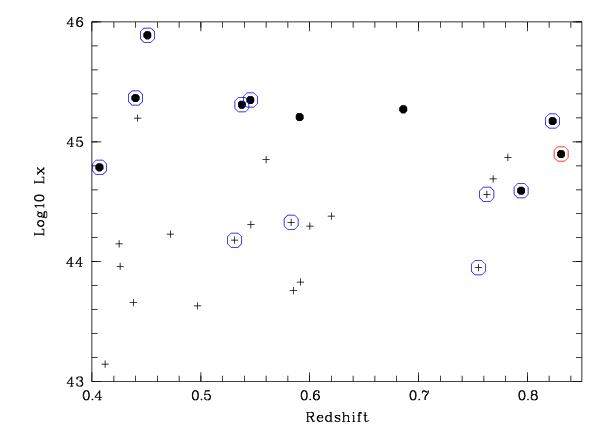
Cluster total X-ray luminosity as a function of redshift. Filled disks are clusters for which substructures were detected with the X-ray method. Crosses indicate clusters with no X-ray detected substructures. The blue and red circles correspond to clusters for which substructures representing less and more respectively than 15% of the total cluster mass (estimated with the SG method) were detected with the SG method.
Current usage metrics show cumulative count of Article Views (full-text article views including HTML views, PDF and ePub downloads, according to the available data) and Abstracts Views on Vision4Press platform.
Data correspond to usage on the plateform after 2015. The current usage metrics is available 48-96 hours after online publication and is updated daily on week days.
Initial download of the metrics may take a while.