Fig. 6
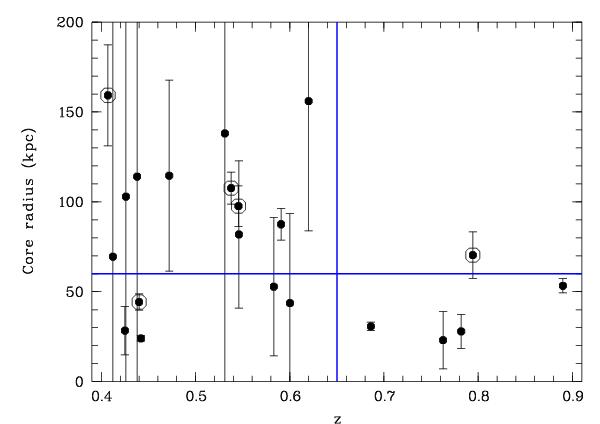
β-model core radius as a function of redshift for the considered clusters (see text). The circled disks are the clusters with detected X-ray substructures. The two lines symbolize the z = 0.65 limit and the maximal value of the core radii for z ≥ 0.65 not significantly substructured clusters (from an X-ray point of view).
Current usage metrics show cumulative count of Article Views (full-text article views including HTML views, PDF and ePub downloads, according to the available data) and Abstracts Views on Vision4Press platform.
Data correspond to usage on the plateform after 2015. The current usage metrics is available 48-96 hours after online publication and is updated daily on week days.
Initial download of the metrics may take a while.