Fig. 5
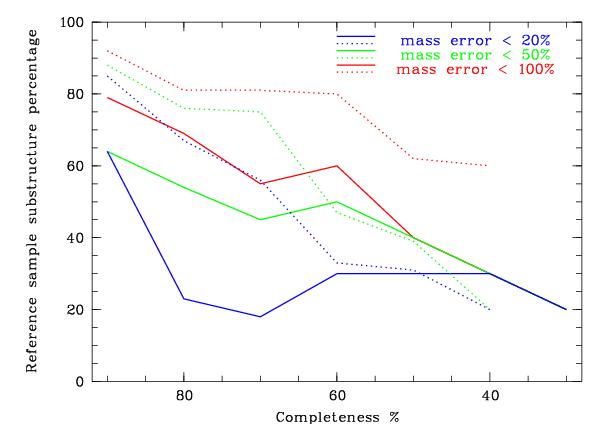
Effects of the undersampling of the input spectroscopic catalogue on the results of the SG method. The figure shows the percentages of substructures in the total reference cluster sample (versus the spectroscopic catalogue completeness percentage) for which the mass estimates are plagued by an error of less than X% (compared with the 100% complete spectroscopic catalogue). Blue lines are for X = 20%, green lines for X = 50%, and red lines for X = 100%. Continuous and dashed lines respectively correspond to substructures that merged and that did not merge with other substructures during the spectroscopic catalogue resampling process.
Current usage metrics show cumulative count of Article Views (full-text article views including HTML views, PDF and ePub downloads, according to the available data) and Abstracts Views on Vision4Press platform.
Data correspond to usage on the plateform after 2015. The current usage metrics is available 48-96 hours after online publication and is updated daily on week days.
Initial download of the metrics may take a while.