Fig. 4
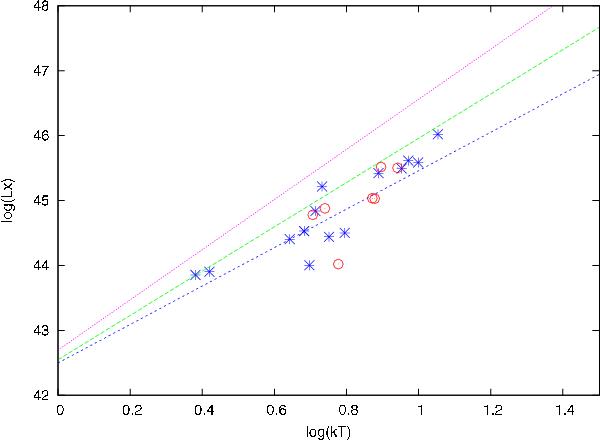
X-ray luminosity as a function of X-ray temperature for our clusters on a logarithmic scale. The blue crosses and red circles represent clusters with redshifts respectively lower and higher than 0.6. The central green dashed line represents the LX–TX relation found by Takey et al. (2011), and the blue and pink dashed lines indicate the uncertainty on this relation.
Current usage metrics show cumulative count of Article Views (full-text article views including HTML views, PDF and ePub downloads, according to the available data) and Abstracts Views on Vision4Press platform.
Data correspond to usage on the plateform after 2015. The current usage metrics is available 48-96 hours after online publication and is updated daily on week days.
Initial download of the metrics may take a while.