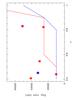
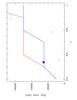
Fig. 3
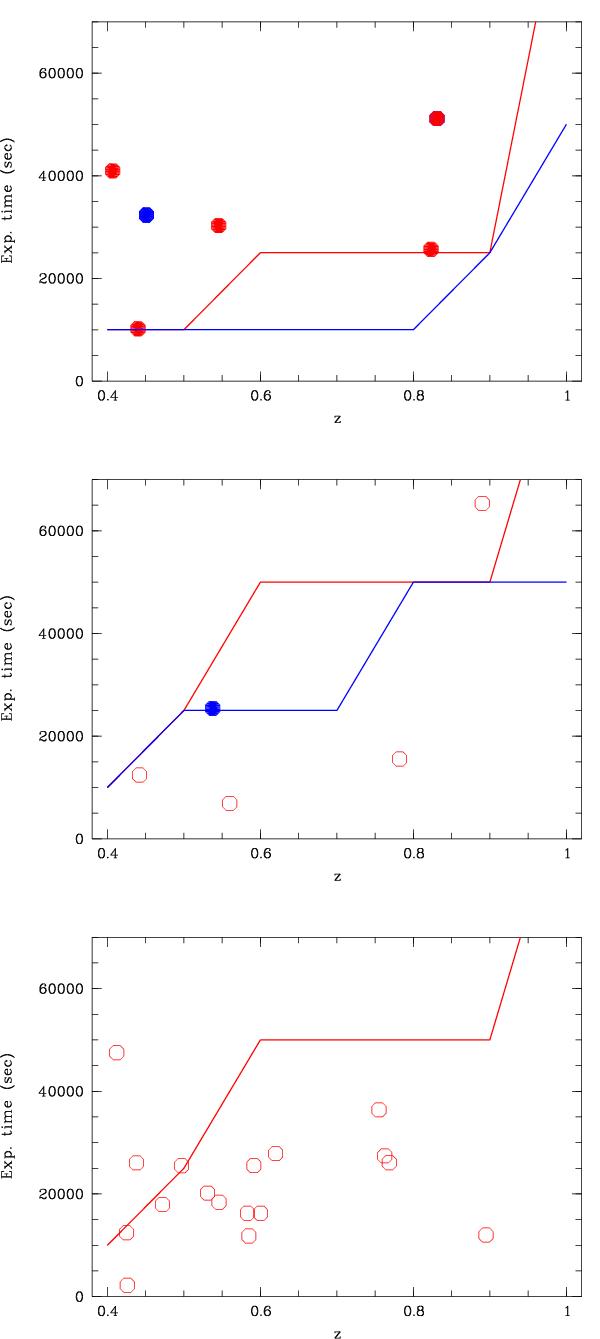
Clusters in our sample in diagrams of useful XMM-Newton exposure time versus redshift. Filled symbols are clusters with one or more detected substructures, and open symbols clusters without any detected substructures. Solid lines are susbstructure detection limits below which it is not possible to detect a substructure. Upper panel: red symbols are clusters brighter than 5.0 × 1044 erg/s with detected substructures fainter than 2.5 × 1044 erg/s and more distant than 7 pixels from the cluster centre (or no detected substructures). Blue symbols are clusters brighter than 5.0 × 1044 erg/s with detected substructures brighter than 2.5 × 1044 erg/s and more distant than 7 pixels from the cluster centre. Middle panel: red symbols are clusters brighter than 5.0 × 1044 erg/s with detected substructures fainter than 2.5 × 1044 erg/s and less distant than 7 pixels from the cluster centre (or no detected substructures). Blue symbols are clusters brighter than 5.0 × 1044 erg/s with detected substructures brighter than 2.5 × 1044 erg/s and less distant than 7 pixels from the cluster centre. Lower panel: red symbols are clusters fainter than 5.0 × 1044 erg/s with detected substructures fainter than 0.4 × 1044 erg/s and less distant than 7 pixels from the cluster centre (or no detected substructures).
Current usage metrics show cumulative count of Article Views (full-text article views including HTML views, PDF and ePub downloads, according to the available data) and Abstracts Views on Vision4Press platform.
Data correspond to usage on the plateform after 2015. The current usage metrics is available 48-96 hours after online publication and is updated daily on week days.
Initial download of the metrics may take a while.