Fig. 2
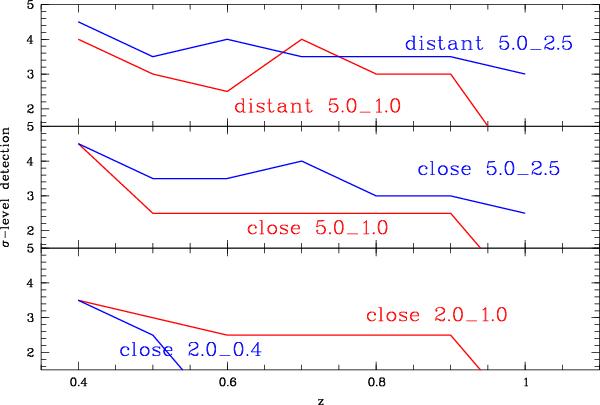
Detection level (in σ units) of the X-ray simulated substructures (50 ks exposures) versus redshift. Lower panel: 2.0 × 1044 erg/s cluster + 0.4 × 1044 erg/s subcluster (close 2.0_0.4) and 2.0 × 1044 erg/s cluster + 1.0 × 1044 erg/s subcluster (close 2.0_1.0). Separated by 6 px in both cases. Middle panel: 5.0 × 1044 erg/s cluster + 1.0 × 1044 erg/s subcluster (close 5.0_1.0) and 5.0 × 1044 erg/s cluster + 2.5 × 1044 erg/s subcluster (close 5.0_2.5). Separated by 6 px in both cases. Upper panel: 5.0 × 1044 erg/s cluster + 1.0 × 1044 erg/s subcluster (distant 5.0_1.0) and 5.0 × 1044 erg/s cluster + 2.5 × 1044 erg/s subcluster (distant 5.0_2.5). Separated by 12 px in both cases. When the line stops, it means that the subcluster is no longer detected. The close 2.0_0.4 configuration, for example, provides detections of the subcluster only up to z = 0.5 at the 2.5σ level.
Current usage metrics show cumulative count of Article Views (full-text article views including HTML views, PDF and ePub downloads, according to the available data) and Abstracts Views on Vision4Press platform.
Data correspond to usage on the plateform after 2015. The current usage metrics is available 48-96 hours after online publication and is updated daily on week days.
Initial download of the metrics may take a while.