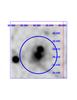
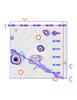
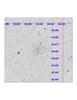
Fig. A.7
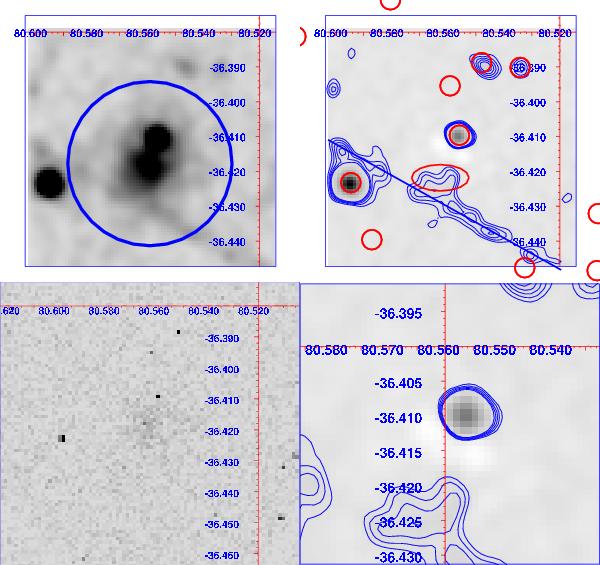
XMM-Newton X-ray image (upper left), residual XMM-Newton image (upper right), Chandra image (lower left), and zoom on the residual XMM-Newton image (lower right). The residual image was obtained by subtracting the model from the XMM-Newton image for BMW-HRI J052215.8-362452. The large blue circle in the upper left panel corresponds to a 500 kpc radius circle centred on the literature cluster position. Finally, blue contours are the X-ray residuals, starting at the 2.5σ level and spaced by 1σ intervals.
Current usage metrics show cumulative count of Article Views (full-text article views including HTML views, PDF and ePub downloads, according to the available data) and Abstracts Views on Vision4Press platform.
Data correspond to usage on the plateform after 2015. The current usage metrics is available 48-96 hours after online publication and is updated daily on week days.
Initial download of the metrics may take a while.