Free Access
Fig. 1
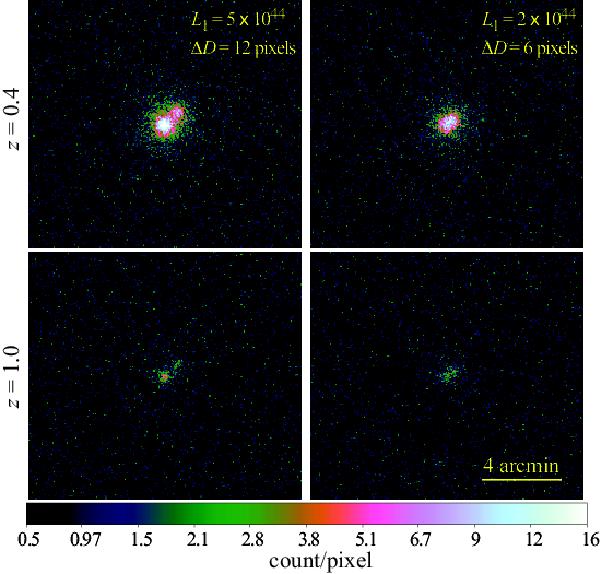
A few examples of simulated images showing the situation where the subcluster can be easily detected (low redshift, well separated) and the case where the subcluster is hardly seen (high redshift, small separation). See text for more details.
Current usage metrics show cumulative count of Article Views (full-text article views including HTML views, PDF and ePub downloads, according to the available data) and Abstracts Views on Vision4Press platform.
Data correspond to usage on the plateform after 2015. The current usage metrics is available 48-96 hours after online publication and is updated daily on week days.
Initial download of the metrics may take a while.