Fig. 8
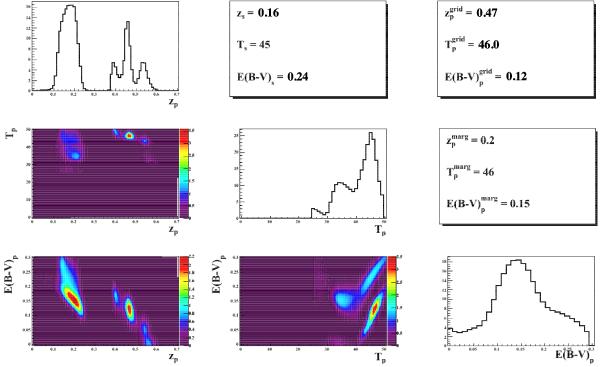
Example of photometric computation for a simulated galaxy observed with the LSST in six bands at 5σ for ten years of observation. The 2D distributions correspond to the posterior probability density functions marginalized over the remaining parameter, and the 1D distributions correspond to the posterior probability density functions marginalized over the two remaining parameters. The top middle panel corresponds to the value of the input parameters. On the top right-hand panel, the index grid denotes the parameters that maximize the 3D posterior probability density function on the grid, and on the middle right-hand panel, the index marg denotes the parameters that maximize the 1D posterior probability density functions. The size of the grid cells has been reduced, and the zp axis has been shortened compared to the size of the grid that is usually used to compute the likelihood function.
Current usage metrics show cumulative count of Article Views (full-text article views including HTML views, PDF and ePub downloads, according to the available data) and Abstracts Views on Vision4Press platform.
Data correspond to usage on the plateform after 2015. The current usage metrics is available 48-96 hours after online publication and is updated daily on week days.
Initial download of the metrics may take a while.