Fig. 7
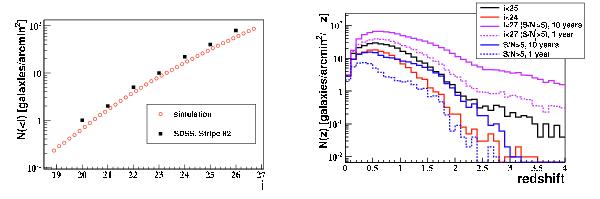
Left-hand side: cumulative distribution of the apparent magnitude in the i band for the LSST simulation compared to the Sloan Digital Sky Survey (SDSS) measurement from the Stripe 82 region (cf. Abazajian et al. 2009). The statistical error bars from the data are smaller than the dots size. Right-hand side: redshift distribution of galaxies for the LSST: i < 24, i < 25 with σi < 0.2 (solid red, solid black curves respectively); i < 27 with S ! N > 5 in at least the i band for one and ten years of observations (dotted and solid magenta respectively); S ! N > 5 in all bands for one and ten years of observations (dotted and solid blue respectively).
Current usage metrics show cumulative count of Article Views (full-text article views including HTML views, PDF and ePub downloads, according to the available data) and Abstracts Views on Vision4Press platform.
Data correspond to usage on the plateform after 2015. The current usage metrics is available 48-96 hours after online publication and is updated daily on week days.
Initial download of the metrics may take a while.