Fig. 4
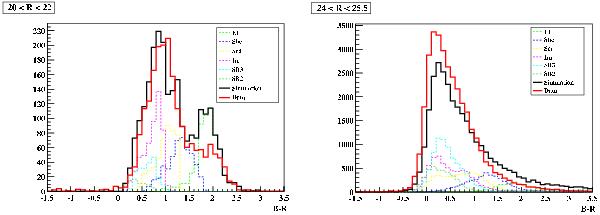
Histograms of the B − R term for different apparent magnitude ranges. Left-hand panel (20 < R < 22) corresponds to the bright galaxies and right-hand panel (24 < R < 25.5) corresponds to the very faint galaxies. The solid black lines correspond to the simulation and the solid red lines correspond to the GOODS data. The dotted colored lines correspond to the main spectral types in the simulation.
Current usage metrics show cumulative count of Article Views (full-text article views including HTML views, PDF and ePub downloads, according to the available data) and Abstracts Views on Vision4Press platform.
Data correspond to usage on the plateform after 2015. The current usage metrics is available 48-96 hours after online publication and is updated daily on week days.
Initial download of the metrics may take a while.