Fig. 3
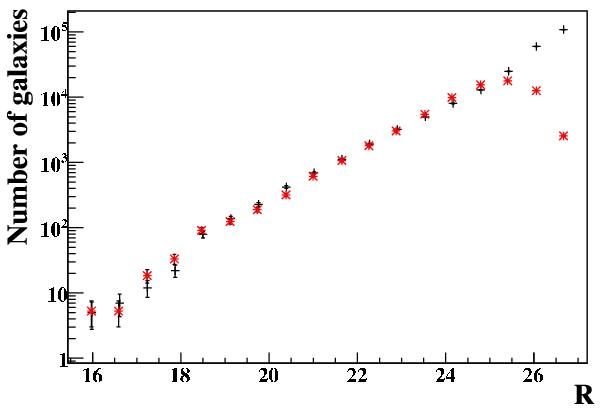
Histograms of the apparent magnitude in the R band comparing the GOODS simulated data (black points with error bars) to the actual GOODS data (red stars). We note that there may be a systematic shift in all data points in the x-axis direction up to R ≲ 0.05 mag due to differences between the simulation and data filter zero points.
Current usage metrics show cumulative count of Article Views (full-text article views including HTML views, PDF and ePub downloads, according to the available data) and Abstracts Views on Vision4Press platform.
Data correspond to usage on the plateform after 2015. The current usage metrics is available 48-96 hours after online publication and is updated daily on week days.
Initial download of the metrics may take a while.