Free Access
Fig. 22
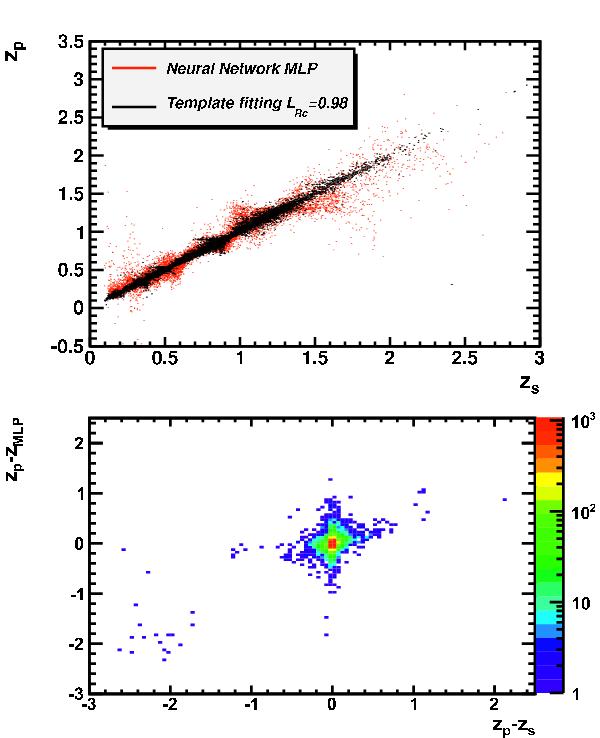
Top panel: zp vs. zs with the template-fitting method in black (selection with LR > 0.98 ) and with the neural network in red for a LSST simulation of ten years of observations. Bottom panel: 2D histogram of zMLP − zp as a function of zp − zs.
This figure is made of several images, please see below:

Current usage metrics show cumulative count of Article Views (full-text article views including HTML views, PDF and ePub downloads, according to the available data) and Abstracts Views on Vision4Press platform.
Data correspond to usage on the plateform after 2015. The current usage metrics is available 48-96 hours after online publication and is updated daily on week days.
Initial download of the metrics may take a while.